

 Thanks:
  Likes:
  Needs Pictures: 0
 Picture(s) thanks:
Results 61 to 75 of 201
Thread: Developments in Dust Sensor tech
-
21st July 2017, 03:36 PM #61
 .
.


- Join Date
- Feb 2006
- Location
- Perth
- Posts
- 27,790
 Yes it can be very frustrating to someone new to the game who doesn't know these things. I learned my "air flow" stuff the hard way back in the early 1980's. Apart from a couple of general circa 1950's engineering books on AC I had no one around to help me, - no internet. Just basic physics and a few pieces of measuring gear.
 Originally Posted by MandJ

I started playing with particle counting when I built my first clean lab in 1985. The first detector I used was a in-house made condensation chamber. It was about the size of a loaf of bread and worked exactly like the issue we are discussing. Air was pumped into a chamber/cylinder which was then temporarily sealed. Inside the chamber a simple photocell/sensor measured the optical transparency of the air inside the cylinder was measured and then a tiny squirt of ethanol was injected into the chamber and a piston rapidly expanded the air which cooled the air and that so that ethanol vapour would condense onto any dust particles - this reduced the optical transparency of the air inside the chamber giving a rough indication of the numbers of dust particles which it printed out on one of those thermal paper strips. I could not run it too often because the rolls of paper had t come from the US and cost around $1 each and that was considered expensive. It was an approximate system but it was VERY sensitive and could easily pick up weather changes, and even traffic density changes on a major road about 5 km away.
With Air flow I started out with two propeller driven units borrowed from the first year labs until out research groups got own hot wire unit. I used that hot wire unit for weeks comparing it to the propellor units and nearly gave it away until I compared it to a pitot tube and realised that it was the propeller units that gave the wrong results in ducting.
With some persistence and care I put absolute air flow measurement in the in the +/-5%range.
Absolute measurement is needed if we want to compare completely independent results - as we all do regularly on this forum
To get greater accuracy than this requires better gear, longer measurement time and increased knowledge about air flow measuring systems.
Accurate particle counting is much harder as all sorts of things can effect measurements humidity being just one. Hence your idea of plotting inside and outside air is a good one. I'd never thought of that because I was thinking old PM10 standards and that humidity does not affect this that much but if we want to work to newer PM2.5 standards then it will have a greater effect. If you can get particles to +/- 20% you are doing well.
Yep it can be life threatening. It's not just spores, it's all dust. If the ground has been very dry for some time big rain drops will kick more dust into the air as well.One thing you mentioned with storms, rain and the readings, reminded me about the research showing a big spike in spore readings as rain drops hit the ground, trees etc. It being a cause of sinus hay fever conditions for a lot of people.
-
21st July 2017 03:36 PM # ADSGoogle Adsense Advertisement
- Join Date
- Always
- Location
- Advertising world
- Posts
- Many
-
21st July 2017, 11:24 PM #62
.
- Join Date
- Feb 2006
- Location
- Perth
- Posts
- 27,790
Apart from the Temp/Humid sensor I have finished the first dust counter (I'm calling it "b") for mens shed dust monitoring and here it is next to the first one I made (I call that one "A") a couple of weeks ago.
You might also note that the are reading the same PM10 value.
This is a fluke because they are rarely the same - at these low levels I don't believe any of the numbers anyway.
CounterB.jpg
The box on B is overkill but the size smaller box I had on hand was going to be too small.
The box for A is a $21 box from Altronics while the one for B is an $8 box from eBay.
I may want to put a battery inside B but I won't do that until I have done a full power assessment.
They will both run on a 5V 2A USB or a 12V power adapter.
Below on B you can see the location of the particle counter (PMS) and the slots where the air goes in and out - grey arrows.
The SD card slots - there's a pause button which is really for programming purposes.
The only user controllable knob on the one is knob R which is a rotary switch so the user can select what value (e.g. PM2.5 or PM10 or numbers of particles etc) they wish to see.
B also has a real time clock so that files on the SD card can be date stamped.
This one cost $64 in parts (not including the SD card) - I want to see if I can get the parts for under $50 so I can make up a number of them to lend out to mens
CounterB1.jpg
A has got a lot more controls on it that can be manipulated without it being connected to a computer.
A touch screen would be nice but that would raise the price significantly - I might make one with a touch screen just for myself but I don't thing giving too much control to mens shed users is good idea,
-
22nd July 2017, 10:35 PM #63
.
- Join Date
- Feb 2006
- Location
- Perth
- Posts
- 27,790
Its been interesting to watch the two counters running side by - one thing I picked up is the input power supply must be up to the task or the readings will be incorrect.
Arduino Mega boards are supposed to be work correctly with input Voltages of between 6 and 20V (recommended is between 7 and 12V) but straying outside the recommended V's seems to cause problems.
Like most people I have a box of adapters scavenged from on electrical gear phones, appliances etc. I test them and if I reckon they may be up t scratch I then add the standard 2.5/5.5mm DC plug.
Using just a 12.8V adapter I noticed an on average shift in readings i.e. ~50% too high. and checking the Arduino 5V bus V I noticed it was getting up to 5.5V - it might be a dodgy Arduino voltage regulator but the other 2 Mega boards did exactly the same.
Interestingly an 11.7V adapter gave an Arduino V of 5.005V, a 6V adapter produced an Arduino V of 4.989V.
At the other end of the scale I decided to try a 5V adapter. As perhaps to be expected this was even worse, with the Arduino 5V bus V only reaching 4.2V and the systematic shift in readings by about a factor of 2!. This suggested the 5V adapter was not even good for its 2.5A rating at 5V
The PMS7003 has a rated V 4.5 to 5.5V but the closer you can get to 5V the more reliable the numbers seem to be. I suspect the different V's change the fan speed. I can check this out directly with one of my spare counters when I get a mo.
-
23rd July 2017, 10:30 AM #64
Supporting my wife's hobby.
- Join Date
- Nov 2013
- Location
- Caboolture QLD AU
- Posts
- 781
That's a strange one, I assume that the reading errors are caused by the sensor itself and it's supply - although that should not be the case unless the regulator input voltage is below the reg drop out, or a higher voltage is feeding back via the digital serial interface or control pins. The main reason a micro normally gives an error is when an ADC inputs are being used (ADC conversion errors) and the Micro supply rail shifts. I found that most problems of high or unstable supply rails are caused by a higher voltage on one of the I/O pins causing a bucking effect into the internal micro supply rail - depending on the micro and I/O input design of course. Like reading a 12v input (either a digital or ADC input pin) and not allowing enough headroom with the input resistive divider, or not clamping it at 5 or 3.3V depending on the micro pin max input spec, Lot of people get caught out in motor vehicle voltage monitoring situations with this by not allowing for IGN pluses etc. Anyway I'm getting off topic again.
Be interesting to see what you find (if it's the fan voltage or another reason), and thanks again for the heads up on this - My unit still shows as being in transit between China and here, but sometimes it shows that when the unit arrives at my door.
Forgot to add - your thoughts on a slight FAN speed change with voltage being the cause is something most of us would not have thought of, and it's so important to the readings, so again another thing I'll keep in mind.
-
23rd July 2017, 02:52 PM #65
.
- Join Date
- Feb 2006
- Location
- Perth
- Posts
- 27,790
You could be onto something here as I am using a 10 position rotary switch wired with 10k resistors in series along the contacts as a voltage divider to select what is displayed. Originally Posted by MandJ
The output of the rotary is converted/read by one of the ADC inputs converted to a single digit between 1 and 11, and although the C10 output is at the bottom of the chain (lowest V) and nothing is read at the top (highest V). Its a clunky system but it works although I may need to check it out a bit closer .
I think we have to keep in mind these are primarily "low cost" rather than high accuracy units, the idea is to have as many as possible of these out there for awareness, monitoring etc. If the fan speed variation only varies the output numbers by only a few % then that will not be a problem as the general sampling problem (no two stands alone counters can sample the same dust/air) the accuracy that can be achieved with these anyway. I need to do more tests - it's still too damp here - but suspect the best general accuracy (in the mid range of its operation) may be greater than the effect of fan speed provided one stays within counter V spec.Be interesting to see what you find (if it's the fan voltage or another reason), and thanks again for the heads up on this - My unit still shows as being in transit between China and here, but sometimes it shows that when the unit arrives at my door..
Forgot to add - your thoughts on a slight FAN speed change with voltage being the cause is something most of us would not have thought of, and it's so important to the readings, so again another thing I'll keep keep in mind.
-
23rd July 2017, 09:42 PM #66
.
- Join Date
- Feb 2006
- Location
- Perth
- Posts
- 27,790
OK I have done the RPM Versus voltage test for the fan on the PMS7003 particle counter.
The specs say the fans operating V is between 4.5 and 5.5 V and that appears to be correct.
I checked the digital tachometer was working properly by getting it and a handheld laser tacho to both measure the RPM of a 12V computer fan with a "white out" stripe painted on the hub of the fan.
I then put a small (1mm) spot of "white out" on the end of one of the black plastic PMS fan blades and I connected the PMS up to a variable V power supply and measured the time between tachometer pulses on an oscilloscope and converted that to RPM.
DustSensorfan.jpg
The digital tachometer when hooked up to an oscilloscope and was able to detect small but clearly visible return pulses from the "white out" spot on particle detector fan - the laser tacho cannot see such a small spot .
The pulse we're looking at are the 4 long narrow dips in the picture, they should be equally spaced but every time I went to take the photo the trace flickered a bit so this is why they are not evenly spaced in the photo, eventually I did get them to stabilise so I could take reliable readings.
The other smaller zig-zags between the longer dips are return reflections from the other non-whited fan blades .
Otrace.jpg
The signal was jumping around a bit but eventually I got it stable enough and using these nice sharp pulses I reckoned the RPM of the fan was stable to within ~2% between 4.4 and 6.4 V. I didn't want to take it any higher than 6.4V as by then it was well outside the spec.
However I didn't think I would hurt if I quickly tried going a bit lower and at 4.3V the frequency was clearly shifting outside the +/-2% and at 4.2V it had dropped by ~10%.
It looks like the sensor has some form of voltage reg built into it so my speculation about it being the fan is looking less likely if you stay inside the V spec..
-
30th July 2017, 03:34 PM #67
Supporting my wife's hobby.
- Join Date
- Nov 2013
- Location
- Caboolture QLD AU
- Posts
- 781
Small update - I'm still waiting for the Sensor - in the meantime I found a screen grab on line of the HEX data as it's received in a Hex terminal program. I don't put a lot of trust in the documents for these things, but once I verified things were all in agreement I wrote a small program to send that data stream every second or so. Wrote another windows program to receive the data and label and display it on screen.
So everything looks good and even the CRC is correct. Then wrote a basic receive program for the Micro and connected up the wireless links - one on the PC and one on the Micro - got everything talking and displaying correct data via the radio link, so now to wait for the sensor and look at what comes back in real time. I hate waiting for things!
-
30th July 2017, 03:41 PM #68
.
- Join Date
- Feb 2006
- Location
- Perth
- Posts
- 27,790
I realise this might be getting a bit boring but here is a 3rd Particle detector most complete - it's the one with the red LED display showing a C10 of 4.8.
It's a copy of the second one (C10 reading 6.4) I made with SD card storage, red LED display but is not so crowded a one end.
The one with the blue LCD display on the RHS is the first one I assembled.
I'm still waiting on Humidity/temperature modules the fit to the two LED display models before sending them out to mens sheds.
The dual Panel meter display gizmo is a V/mA I put together earlier this week.
The Black box, Blue LCD display unit is the first CO monitor I assembled.
3amigos.jpg
-
2nd August 2017, 09:52 PM #69
Supporting my wife's hobby.
- Join Date
- Nov 2013
- Location
- Caboolture QLD AU
- Posts
- 781
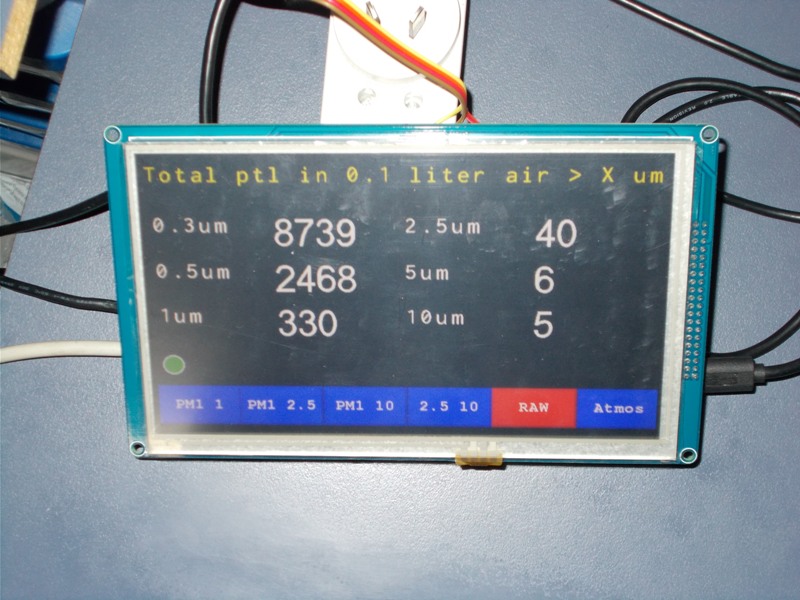
Been playing around coding one of the Modules that I use for various projects - Still no sign of the sensor, anyway I thought for now that I'd show all available data from the unit via touch screen buttons. When I get to play around with the sensor I'll see what's needed. I decided a chart is not the best for viewing from a distance and a bar chart may be better. As it's a touch screen, touching a vacant spot can bring up a second menu for charts and graphing if needed, I definitely want to do an Air Quality display and add some settings for sample rate, logging and Air quality limits as suggested in your thread, I want them to be for Australian Wood conditions and err on the safe side.
Currently sending data via a radio link from the Main PC sending test sample data. Just need the dam sensor and I'm off.
NOTE: I stick an old plastic film over the screen when I'm playing with it like this - so photos look a bit poor.
-
3rd August 2017, 11:58 AM #70
.
- Join Date
- Feb 2006
- Location
- Perth
- Posts
- 27,790
Hi Mike,
Love that display.
A few of things you may want to consider/look at.
1) The instantaneous output data (~1 set of data /s) from the particle counter are identical in batches of 3.
This is best seen in the 0.3micron data
PMS7003data2.jpg
I reckon its the same data being picked off by the serial request from the microcontroller - maybe your setup won't do that and/or you could investigate this.
Because of this I only capture/display and average every 3rd data set.
2) Single output data sets can be noisy
Some of this is real but much of it is not.
If there's no one in a room, and the room is reasonably air tight and there's no significant dust making activity going on, then the counts should not change over a short time (minutes) period outside statistics.
For a given count the 1stdev uncertainty is the square root of the count.
For the average of the above 3 micron data (1030) counts the one stdefv uncertainty should be +/-32 (2 Stdevs = +/- 64)
~ 95% of data should then fall between 966 and 1094 counts which you can see above is not the case.
Sometimes the data is within stats and other time it's not.
I've explored averaging and averaging with some rejection of particle count data (e.g. highest and lowest values). The question is over what time period to average. Too short and the data gets noisy and too long and you may miss some real high or low points.
Although I collect all the data I've settled for summing every 10 data points and then displaying the particle count data as a sum of all 10 points.
This effectively converts the data from particles/decilitre to particles/litre which is a common standard amongst particle counters.
It also improves the stats and what can be displayed.
3) Notice how the instantaneous 2.5, 5 and 10 micron particle number data are very small and only even numbers.
This is because these numbers are calculated inside the counter using some sort of multiplier function - This makes these low values numbers almost meaningless.
The +/- 2 x SQRT of a count of "2" particles is "2.8". In turn this means the concentration component of the 5+10 micron contribution (2 - 4 ppb) to the PM10 total concentration in the above table is >+/-100%
In other words any comparisons made using these instantaneous concentration levels are likely to be meaning less.
Worse still (along the same lines as poor air flow measurements) will be folks chasing their tail making changes to dust extraction systems based on this sort of meaningless data
Given I'm using devices with limited display space/characters) I'm now considering displaying any instantaneous concentrations of <10 ug/m^3 as just "<10 ug/m^3"
Because you have the real estate on your screen you may wish to make a more meaningful statement/comment on the instantaneous concentrations data.
Averaging the instantaneous concentration data over a given time period is technically valid but one still needs to be careful about displaying data beyond their meaningful stats. I realised this yesterday as some of my averaged concentration data are now being displayed within 0.1 ug/m^3 ~
If 10 data points are averaged then the most I reckon one should display the data to is 1 ug/m^3 the reality is probably more like 2 ug/m^3
4) Counter limitations
The counter software has a 700 ms delay between serial requests from the counter, any longer leads to checksum errors.
This means if the software does any other processing or data collection from there sensors in-between the serial requests then this delay needs to be adjusted accordingly.
My latest version of the software had that delay down to ~400 ms delay, mainly because of all the averaging and other stuff to do with displays.
Yesterday the the DHT22 Humidity/temp sensors arrived (I'm putting one on these in all my setups) and I found I could not collect data from this sensor within the 400 remaining ms and had to put the DHT sensor data collection at the end of each batch of 10 counter data sets collected (i.e. every 30s) - I doubt that the T&H is going to change that fast so this should be OK.
Hope all that is of some use.
-
3rd August 2017, 12:45 PM #71
.
- Join Date
- Feb 2006
- Location
- Perth
- Posts
- 27,790
Forgot to mention I am working on another dust detection system.
This one measures sawdust in kgs !!!!
It's a weight sensor to determine if a sawdust bin needs emptying.
I got the prototype and software working on the bench last night.
The force sensor is that gold foil rectangle which is an up to 50kg rated thin film variable resistor.
The resistance ranges from >500kΩ near zero to around 70kΩ at 50 kg.
Placed in a voltage divider the output V can easily vary enough to be picked up by a microcontroller
IMG_2417.jpg
The resistance of the force sensor is inverse exponential and I calibrated it on a set of bathroom scales using lead weights.
The force sensor will be embedded into a thin rubber pad and placed under the front bottom edge of wheelie bin collector at the ends shed.
The wheelie bin wheels should take about half the weight and the front edge of the bin should take the other half.
The sensor will be connected to the micro controller back inside the shed.
The % fill of the bin is displayed on the LED display.
Switch "Sw" can be switched to display the required alarm level using pot "P" .
Then Sw is set back to display.
When %fill of bin exceeds the alarm level the alarm (A) will sound.
Of course a much bigger alarm on a relay will be used in practice.
A secondary calibration will be needed with the sensor under the bin font edge and will take place with the bin near full
Trim pot "T" is part of the voltage divider and is part of the secondary calibration system,
IMG_2416.jpg
As usual the much of the real work is in the turning the prototype into a robust actual product.
Total cost of parts is ~$25 excluding the alarm - given how deaf the men's shed members are it will need to be LOUD.
No I am not making these for sale - software will be free to anyone that wants it.
-
3rd August 2017, 01:17 PM #72
Supporting my wife's hobby.
- Join Date
- Nov 2013
- Location
- Caboolture QLD AU
- Posts
- 781
Thanks Bob, the screen shown was a 7", I've just plugged in the 5" (now nice and compact) and it looks just as good and as readable.
The information you provided is really helpful, I can refer to it when I finally get the sensor and get some real data.
One of the things I was looking at in the Sensor data sheet was the change in update speed with sudden changes in particle count.
QUOTE:
The output is divided into active and passive outputs. After the sensor is powered on, the default state is active output
The sensor sends the serial data to the host, the time interval is 200 ~ 800ms, the air concentration of particles
High, the shorter the time interval. Active output is divided into two modes: smooth mode and fast mode.
In the air Particle concentration changes less, the sensor output for the smooth mode, that is, every three times the same set of output values,
The actual data update period is approximately 2s.
When the concentration of particles in the air changes greatly, the sensor output automatically
Switch to fast mode, each output is a new value, the actual data update cycle of 200 ~ 800ms.
I'll have no trouble detecting this in code and allowing for a change in averaging if needed and depending on what data is coming in.
At the moment I have an error window pop-up for any RX errors, I have forced it to pop up a CRC error when purposely trying to overload the radio receiver link TX/RX limits - The window auto clears with the next valid packet and of course the bad data is not saved or used in any calculations.
I've got a small buffer on the RX side and I have the RX port interrupt driven, so hopefully I should only get a CRC error with a Radio link error - Famous last words.
Mike.
-
3rd August 2017, 01:52 PM #73
Supporting my wife's hobby.
- Join Date
- Nov 2013
- Location
- Caboolture QLD AU
- Posts
- 781
What a brilliant idea and overcomes the problem of using a different type of sensor (optical) in a bin full of swirling sawdust.
-
3rd August 2017, 02:08 PM #74
.
- Join Date
- Feb 2006
- Location
- Perth
- Posts
- 27,790
I tried an optical sensor a few years back but it was exactly as you said - couldn't distinguish between swirling sawdust and full bin. Originally Posted by MandJ
-
3rd August 2017, 09:57 PM #75
Supporting my wife's hobby.
- Join Date
- Nov 2013
- Location
- Caboolture QLD AU
- Posts
- 781
Bob, just as a matter of interest, I timed the Decode - Display procedure - from been handed a complete packet to decode and display in the RAW screen (most writes) it took a total time of 51ms. Screen writes are fast in this thing, and I've got the micro clocked back 20% because the 5" displays have a problem with higher data I/O clocking.
While the Decode - Display code is running, the receive Interrupt is still receiving and storing the next packet ready to be send to the Decode procedures. The way it is now, I can't overrun and get a CRC error, the only thing that can happen is that I just drop the occasional packet if data is shot-gunned at the receiver - I don't think the Sensor can TX that fast.

 Reply With Quote
Similar Threads
-
Latest Shed Developments
By RufflyRustic in forum WOODWORK PICSReplies: 56Last Post: 27th September 2008, 10:26 AM -
dust level sensor for cyclones
By JDarvall in forum DUST EXTRACTIONReplies: 0Last Post: 21st August 2008, 05:36 AM -
Table saw blade alignment - Lo-tech / Hi-tech
By niki in forum TABLE SAWS & COMBINATIONSReplies: 6Last Post: 25th February 2008, 04:32 AM -
Power feed for HM-45 Mill....developments
By Sterob in forum METALWORK FORUMReplies: 10Last Post: 13th May 2007, 07:58 PM -
Sensor Light
By Garves in forum GENERAL ODDS N SODSReplies: 12Last Post: 9th June 2006, 10:42 PM
