

 Thanks:
  Likes:
  Needs Pictures: 0
 Picture(s) thanks:
Results 76 to 90 of 201
Thread: Developments in Dust Sensor tech
-
5th August 2017, 11:32 AM #76
 Supporting my wife's hobby.


- Join Date
- Nov 2013
- Location
- Caboolture QLD AU
- Posts
- 781

Bob, I've got my AQI meter coded and as this is going to be for a wood working environment, although I can set the range to anything in the settings menu, I'm wondering if it might be advantageous from a wood working point of view to have two AQ! indicators, one for PM2.5 and one for PM10, or just do a calculation to combine them into one AQI?
BTW the big Graphic gauges look really nice on screen.
-
5th August 2017 11:32 AM # ADSGoogle Adsense Advertisement
- Join Date
- Always
- Location
- Advertising world
- Posts
- Many
-
5th August 2017, 12:22 PM #77
.
- Join Date
- Feb 2006
- Location
- Perth
- Posts
- 27,791
Given that these are really PM2.5 detectors and not true PM10 detectors I would show both. Originally Posted by MandJ

-
6th August 2017, 11:22 AM #78
Supporting my wife's hobby.
- Join Date
- Nov 2013
- Location
- Caboolture QLD AU
- Posts
- 781
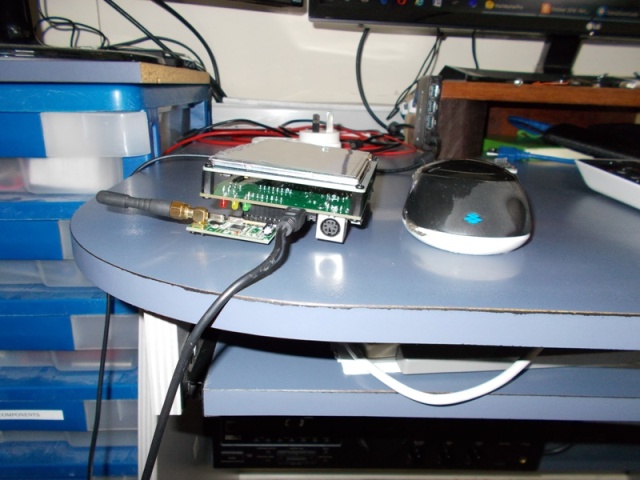
I normally do the display exactly as BobL has done using a simple 2 line LCD, this keeps cost and size down, however as this is just for me and I have two of these newer microcontroller devices, and as 5" or 7" screens are around $30 AU, I thought why not. So here is the 5" display showing overall size and the AQI screen indicators. BTW there is no OS on this board so at power on it instantly shows the dust display screen and is receiving data.
These will the last pictures posted, the following posts (hopefully next week) will have the data readings from the workshop and from the DE unit outside the WS.
5" Display with a small radio receiver plugged into a skt on the back of the micro board. Again, dirty plastic film over the screen while testing and coding.
AQI gauges - blindingly fast pointer updates - faster that writing a Number.
Small dark green dot between the gauges is a virtual Receive LED indicator.
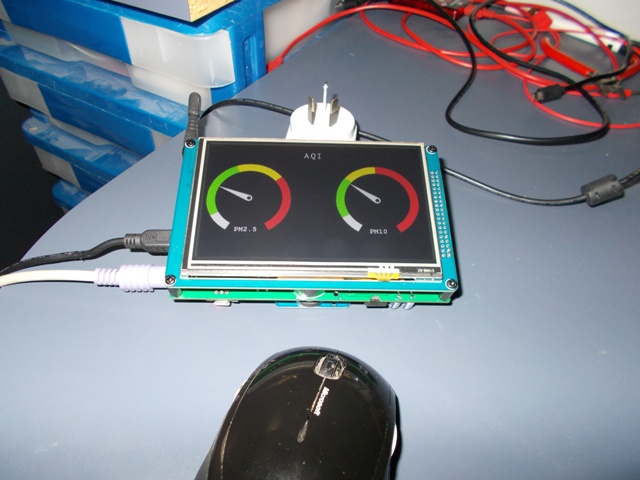
Idea of thickness of combined micro and 5" display - Radio module will be relocated when unit gets put in a case.
-
6th August 2017, 01:10 PM #79
.
- Join Date
- Feb 2006
- Location
- Perth
- Posts
- 27,791
Looks Good!.
The other graphical approach I quite like is the AQI website data representation for PM2.5 and PM10.
48 hours is a bit long buy certainly the time while in a shed would be useful
Screen Shot 2017-08-06 at 10.07.02 am.png
-
6th August 2017, 02:13 PM #80
Supporting my wife's hobby.
- Join Date
- Nov 2013
- Location
- Caboolture QLD AU
- Posts
- 781
Yes that is something I was going to do once I get a feel for the data. Initially I wanted a easy to see indicator in real time on the gauges. - From my brief read of how an AQI is calculated it appears to be still a lot of arguments as to how long and varies with the local pollution when AIQ is measured, and there appears to multiple sensors involved for various pollutant gases.
The idea of displaying data over a selectable time period applicable to time spent in the WW shed is something I'm keen on doing - as in the picture you linked to, will look good when done.
BTW I'm planning on posting a thread in the electronics section about the micro I'm using and how it relates to other more common solutions out there. I'll include how you code it and set it up and costs.
Cheers
-
9th August 2017, 03:49 PM #81
Supporting my wife's hobby.
- Join Date
- Nov 2013
- Location
- Caboolture QLD AU
- Posts
- 781
Want to hear something really funny? AuPost left a card in my letter box yesterday, small parcel to pick up at Post Office . Rock up this morning, can't find parcel, Postie who left card is off sick , can't find item, check sick postie bike - no, check collection centre - no, we'll let you know - soon -sorry.
But in the meantime I have a screen like you posted above up and running.
-
9th August 2017, 06:15 PM #82
Supporting my wife's hobby.
- Join Date
- Nov 2013
- Location
- Caboolture QLD AU
- Posts
- 781
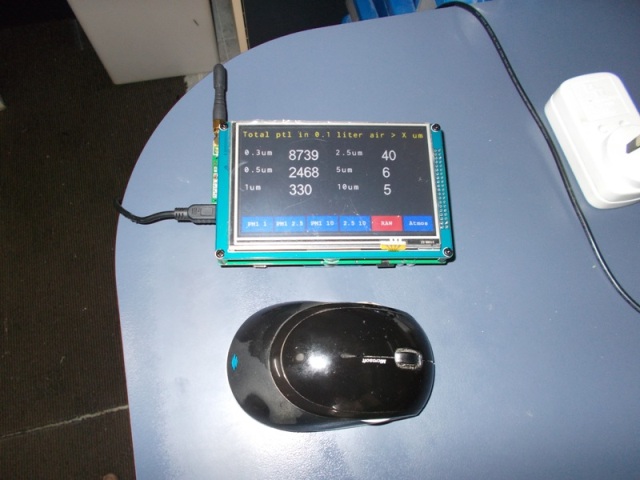
Know I said I wasn't going to post another photo, but, here is another screen shot, very hard to get good contrast with the camera flash washing it out.
This is being updated every second, sending random data packets every 180 Ms, has not missed a beat. The graph looks a bit scratchy but that is just the 1 second update and 180 ms packet crazy random data, all trying to break the code.
Updates are selectable from 1 second to anything you like. Some work on the averaging selections and AQI code still to be finalised. I' going to add a screen for full screen graphs for clearer view across the room. You could set it to record 8 minutes or 1 hour of data per graph all the way up to 8 hours. I'm aiming this at the WW shed and the time frames I'd like to monitor.
-
10th August 2017, 04:11 PM #83
Supporting my wife's hobby.
- Join Date
- Nov 2013
- Location
- Caboolture QLD AU
- Posts
- 781
Well APost found the missing Sensor. Got it about 40 minutes ago. Got soldering out, connected the leads from the tiny Sensor to equally tiny Radio transceiver, turned it it on and !!!! my program decodes and runs 100% - radio link 100%.
When first turned on, the readings were extremely high at around 277 and 367, AQI meters and graph were in the red, after about 25 minutes they came down into the bottom of the green. PM2.5 = 6 and PM10 = 7 and still slowly dropping - looks like that minute of soldering a few connections in the closed WS had caused it. Just soldered one lead a few feet away and got an almost instant spike, looks good on the graph, two narrow sharp red spikes, takes quite a while to come back to normal background as I have not opened the WS door. Recording and averaging is at 10 seconds intervals at the moment - about 130 minutes on the graph.
The bloody Main PC decided to hang for the first time in as long as I can remember, I had 10 minutes of code changed in the editor and on reboot had lost that last 10 minutes - however the program was in the Microprocessor memory as I was running that code at the time, I was able to retrieve that back from the Micro memory and into the PC editor and lost nothing
That AQI graph looks brilliant, can't wait to code the full screen graphs. The PM2.5 and PM10 count on the graphic meter displays are also just brilliant when looking at the screen from 5m away.
Running out of time and thought I'd give a quick update before heading out.
-
10th August 2017, 05:19 PM #84
Supporting my wife's hobby.
- Join Date
- Nov 2013
- Location
- Caboolture QLD AU
- Posts
- 781
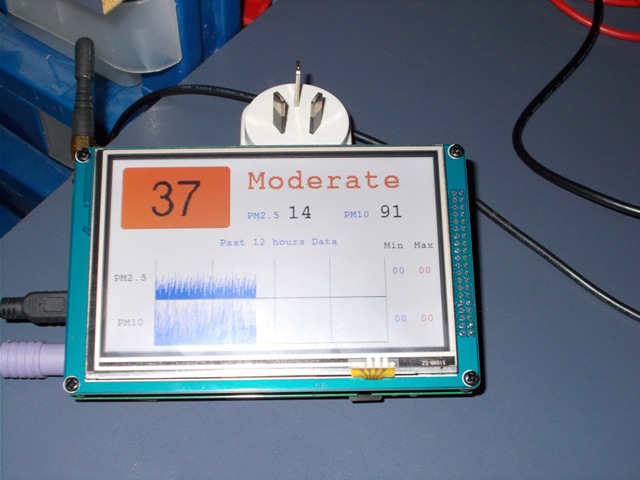
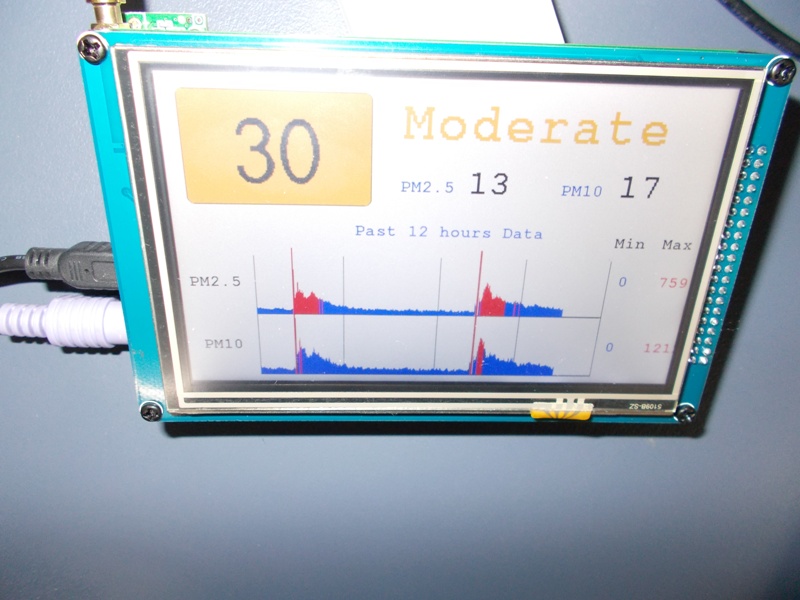
Managed to grab a photo. Ignore the "Moderate" and "30" AQI display, I was about to code that when the sensor arrived, so later tomorrow at this stage before I get a chance to do that. Also Minimum value of 0 on the RH side of the graph is caused by me having the counter initialised to 0, so obviously none of the readings would be below 0, so it stayed there, I was in the process of coding al of this when the PC hung - looks like a bad Driver and cheep USB device being unplugged did it.
The two spikes are when I was soldering for less that a minute, sensor is 1.5m away and at the same level as the iron, and it still went way up, fumes likely followed me as I walked over to the PC desk.
That's just over an hour on the graph, PM2.5 and PM10 at the top are not averaged in the code they are straight from the sensor and are quite smooth (sensor in sending same 3 times mode).
-
11th August 2017, 09:07 PM #85
Supporting my wife's hobby.
- Join Date
- Nov 2013
- Location
- Caboolture QLD AU
- Posts
- 781
Found some time to finish the AQI value display and colours. The AQI background label (yellowish in prev post), warning level ("Moderate" in prev post) and graph colours now reflect one of the current AQI systems with all colours and AQI values and warnings.
The only concession is Yellow in the chart colour, it's replaced with Blue, Yellow is not a good colour to view on screen. Tried it out a few minutes ago and it's just brilliant. I have to put the sensor, transmitter and battery in a small box before I can do any Dust readings. The "other hobby" part of the shed is 6m x 6m and sealed from the Wood Work section. I'm blown away with the difference opening a small door in this part of the shed has on the rate that soldering fumes drop. With the door closed, about a minute of soldering will put the AQI in the Sensitive area and climbing, it takes about 1 hour to come down to base line if I turn off the iron after the first minute. If I open a small door that is 5m away from the soldering station, the readings come down in about a third of the time. To think that I've spent hours in there with the door closed on cold nights and days, I really must put in that small extractor fan with a fitting down close to the soldering station, I been meaning to do for years.
BTW I'm sitting at the computer typing this and just noticed the graph suddenly sitting at Moderate (AQI = 82 - Pm2.5 = 27), asked Wife if she was painting or something, she's ironing some fabric (and using a tiny bit of fabric spray - Real time graph is amazing - about to make it so that if you touch the PM2.5 section of the graph it goes to near full screen, likewise for the PM10 graph section.
-
11th August 2017, 10:33 PM #86
.
- Join Date
- Feb 2006
- Location
- Perth
- Posts
- 27,791
Looks good.
Same here. Every now and then I get some mild asthma and just a couple of soldered joints sets me coughing - even just thinking about it now sets me coughing COUGH - COUGH!To think that I've spent hours in there with the door closed on cold nights and days, I really must put in that small extractor fan with a fitting down close to the soldering station, I been meaning to do for years.
Since I'm using lead free solder it's just a matter of reducing the levels of the particulates so I have been thinking about just setting up a large computer fan that sucks air through a couple of small vacuum cleaner HEPA filters.
I just checked my vacuum robot supplies and see there are a few spare HEPA filters in the box and I have a couple of 4 and 6" computer fans in the shed so I might have a crack at putting something together tomorrow.
Guess what will be going on the front of the fan?
Then the particle counters can be used to test the efficacy of the setup!
If you are using leaded solder you will need an activated charcoal filter or vent the fumes completely.
-
12th August 2017, 09:13 AM #87
Supporting my wife's hobby.
- Join Date
- Nov 2013
- Location
- Caboolture QLD AU
- Posts
- 781
Good idea, I was tempted to but one of these solder fume filters from Jaycar - https://www.jaycar.com.au/solder-fum...actor/p/TS1580 - but I don't know what type of filter is used on it - they also sell a pack of 9 filters.
SHMBO, apart from Wood turning, also does quilting, painting and wood burning (pyrography). I normally have to leave the hobby workshop when she does pyrography and painting, so I'm thinking of a small flexible drop down ducting connected to a ceiling mounted fan venting through a roof fitting might be the way to go, could then have the hose + hood close to or above the source of the pollutant. Cost would be less than the Jaycar unit as I also have Fans and through roof fittings.
BTW I'm calculating both PM2.5 and PM10 AQI readings and only showing the higher AQI, I'm thinking of showing both. Obviously AQI is time based, so I have the option of showing a current instant value, the AQI over 1 or 8 hours and can take then take the data to the PC and show the results over a longer time frame again. Slowly getting my head around the vague and complex descriptions of some of this on the net, without the information you have posted it would have been a lot harder, but hopefully it will become clearer as I read more on the subject and play with the unit I've made. I will use this unit as a basis for a post in the electronics section and make the code (program) available when it's finished if anyone is interested.
-
12th August 2017, 11:09 AM #88
.
- Join Date
- Feb 2006
- Location
- Perth
- Posts
- 27,791
Its a basic sort of activated charcoal filter. Efficient activated charcoal filters have to be relatively thick to work properly and those I have seen on soldering fume extractors seem a bit on the thin side to me. Thicker filters require a lot more fan suck than usual which is probably why the filters on soldering stations are on the thin side. Originally Posted by MandJ
At work we performed lead analyses on many types of samples, ranging from leaded and unleaded petrol, food stuffs and containers, wine, vegetation (thousands of air samples) and polar ice which contains many 1000's of times less lead than urban air and water. To prevent contamination of samples from the cleaner environments we had to go to extremes to set up ultra clean labs. We did experiment with activated charcoal filters and found they we only partially effective. Where the lead was in particulate form (dust) using a better grade of HEPA filter was better than the standard 25mm thick activated charcoal filters.
When super grade HEPA's became readily available (>99.9997% @ >0.3 microns) using a pair of these filters in series pulls 99.999 999 999 1 % of >0.3 microns dust from the air. This means urban air of ~30,000,000 particles of dust per cubic metre is theoretically reduced to 0.0003 particles of >0.3 microns per cubic metre, or one particle every 3300 cubic meters. In practice, the filters themselves, and other lab equipment and operators lab wear generated way more dust than this so we didn't quite get this performance.
Activated charcoal filters work better on vapours than particles but most of the lead from solder fumes will immediately cool to particulates so it's not vapour. The activated charcoal will help filter out the amount of odour produced by soldering but just like vision and visible dust, smell isn't always the best indicator of vapour problems.
.. . thinking of a small flexible drop down ducting connected to a ceiling mounted fan venting through a roof fitting might be the way to go . . .
Yeah complete extraction, such as for WW dust, is better especially if you do a lot of soldering, then you don't need to worry about any filters.
My electronics area is in my study inside the house and the roof over it has no cavity, just insulation bats so I would have to go through that then to a roofline chimney, or through the walls. It's not like I do a lot of soldering and having the particle counters will allow me to check the efficiency
Good idea.I will use this unit as a basis for a post in the electronics section and make the code (program) available when it's finished if anyone is interested.
-
12th August 2017, 11:30 AM #89
Supporting my wife's hobby.
- Join Date
- Nov 2013
- Location
- Caboolture QLD AU
- Posts
- 781
Thanks for that, glad I decided to skip the Jaycar model.
Just a thought, have you considered connecting 3 bright LED lights for AQI in Green, Yellow and Red to the small counters, really grabs your attention and might be more meaningful to the typical men's shed.
-
12th August 2017, 12:09 PM #90
GOLD MEMBER

- Join Date
- Aug 2016
- Location
- Brisbane
- Age
- 57
- Posts
- 1,315
I just found this thread and it's very interesting to me. I'd do one myself but I don't have the time. Plus I personally have plenty of basic things to do to improve my shed environment without needing a meter to tell me so.
So I'm just letting you know that there's others following your progress. Keep us informed.
Sent from my SM-G935F using TapatalkMy YouTube channel: https://youtu.be/2_KPRN6I9SE


 Reply With Quote
Similar Threads
-
Latest Shed Developments
By RufflyRustic in forum WOODWORK PICSReplies: 56Last Post: 27th September 2008, 10:26 AM -
dust level sensor for cyclones
By JDarvall in forum DUST EXTRACTIONReplies: 0Last Post: 21st August 2008, 05:36 AM -
Table saw blade alignment - Lo-tech / Hi-tech
By niki in forum TABLE SAWS & COMBINATIONSReplies: 6Last Post: 25th February 2008, 04:32 AM -
Power feed for HM-45 Mill....developments
By Sterob in forum METALWORK FORUMReplies: 10Last Post: 13th May 2007, 07:58 PM
